 Mark Jennings
Start with the number that should not be possible. Two London teaching hospitals sit 25 miles apart and serve women with all but identical health profiles. At one, 13.4% of births are by emergency caesarean. At the other, 35.8%. That is 2.7 times the surgery, in the same city, for the same kind of patients.
The reassuring response is to reach for case mix and explain the gap away. The more useful response is to read it as an experiment the system has already run and never marked: two services, similar women, different choices, different results. The findings are sitting in data the NHS already holds.
Maternal choice belongs at the centre of every one of these decisions, and informed choice depends on good advice. Every midwife and every obstetrician we have worked with advocated for what they believed was best for the mother and baby in front of them. So the variation is not a story about effort or intent. It is a story about evidence applied unevenly, because it is not strong enough, or not shared widely enough, to settle the question.
What the data shows
The Strasys Maternity Index is built on the national Maternity Services Data Set, covering 1,063,560 births in the 24 months to March 2026. When we set each trust's caesarean rate against the health of the women it serves, the relationship all but vanishes.
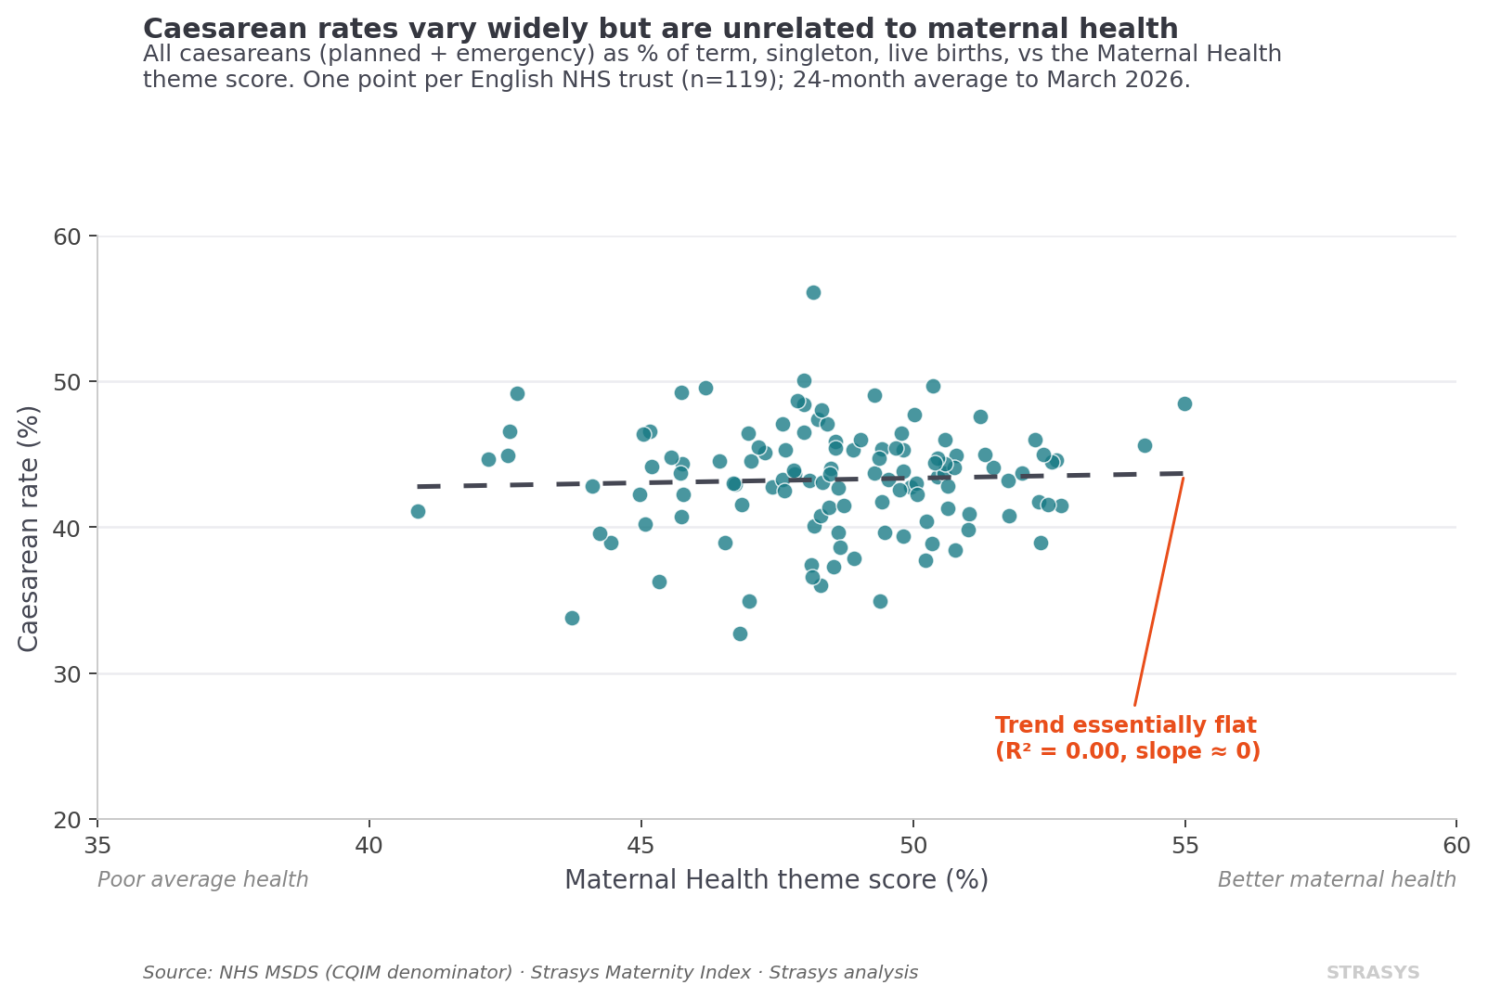
Across all 119 English trusts, a trust's caesarean rate tells you almost nothing about how healthy its mothers are. The two London hospitals make that abstract finding concrete. Their maternal health profiles are all but identical, 48.2 against 48.3 on our scale. And the easy explanation runs the wrong way. The hospital with the lower emergency rate runs the higher level of neonatal intensive care, level 3 against level 2, so it should be seeing the more complex cases, not the simpler ones.
Look closer and a pattern worth testing appears. The lower-rate hospital has one of the highest planned caesarean rates in England, 29.6% against the other's 20.1%. Better case screening and earlier, planned intervention may be heading off the higher-risk emergency caesarean before it becomes necessary. We cannot prove that from aggregate data. But it is the kind of question the variation makes worth asking.
What it means
England's overall caesarean rate, planned and emergency together, sits at around 46%. The evidence puts a floor near 9%, below which mothers and babies come to harm. The World Health Organisation sets the band where surgery still confers a mortality benefit at 10 to 15% of births, with others putting it nearer 19%. The average matters, but it is not the story. The story is the spread, and the spread is far wider than clinical need can explain.
One finding from the Index sharpens why this matters. Healthier women are more likely to receive intervention in childbirth, not less. They are slightly less likely to have an emergency caesarean, as you would expect, but more likely to have a planned caesarean, and considerably more likely to have a forceps delivery. So who is getting the worse deal: healthier women receiving interventions they may not need, or less healthy women missing the ones they do?
So which approach is right? We cannot say from this data. That is precisely the point.
The figures are published only as trust-by-month aggregates. We can see that a service pairs low intervention with good outcomes, strong Apgar scores, low rates of serious haemorrhage and tearing, very low neonatal readmission. What the aggregates cannot tell us is what happened to each woman: how she presented, what was done, and what followed. With pseudonymised patient-level data across the more than a million births already recorded, that question is answerable. Without it, the experiment stays unread.
What a board can do with this
This is the case for a national health service. We pay for it together, so we should learn from it together. The answer to the caesarean question is already inside the system. Finding it does not need a new platform or a large procurement. It needs curiosity, clinical and operational judgement, and access to data the NHS already holds.
For a board, the move is smaller than it sounds. Stop reading your own variation as a number to defend at the next meeting, and start reading it as the result of an experiment you can learn from. Take one measure where your service sits at the far end of the national range, and ask not how to defend it, but what you would need in order to explain it. A service that gets this right does more than spare mothers and babies avoidable harm. It stops spending theatre time, beds and clinical hours on interventions that were never needed, in a system that is short of all three.
Key definitions
Common questions
References
- Mark Jennings, June 2026. Experimentation in the public sector, and what 25 miles can do to caesarean rates. First published on LinkedIn. linkedin.com
- BBC, 5 June 2026. One in four births in England is now emergency caesarean, BBC analysis shows. bbc.co.uk
- Montoya-Williams D, Lemas DJ, Spiryda L, et al. What Are Optimal Cesarean Section Rates in the U.S. and How Do We Get There? J Womens Health (Larchmt). 2017 Dec;26(12):1285-1291. pmc.ncbi.nlm.nih.gov
- World Health Organisation, 14 April 2015. WHO statement on caesarean section rates. who.int
- Molina G, Weiser TG, Lipsitz SR, et al. Relationship Between Cesarean Delivery Rate and Maternal and Neonatal Mortality. JAMA. 2015 Dec 1;314(21):2263-70. pubmed.ncbi.nlm.nih.gov