Strasys Maternity Index.
Where a woman gives birth should not decide how safe she and her baby are.
We measure every maternity service in England every month. Ask Mia what it shows about yours.
The Strasys Maternity Index (SMI) reads more than 100 measures from national data for all 118 maternity trusts. Mia, our AI agent, answers your board's questions in plain English and shows the source behind every figure. Try Mia: Maternity Intelligence Agent.
Questions every board should be able to answer
Pick a question and watch Mia, our Maternity Intelligence Agent, answer it from your trust's data. Mia shows its sources and says when the evidence is too thin to call.

A reconstruction of Mia's chat window. Each answer is built from the SMI's own data and Mia's own analysis tools, for one trust, anonymised, August 2026 (provisional). Mia does not make clinical decisions. How we govern AI
Read Mia's five answers as text
How safe are mothers and babies in our care, compared with trusts like ours?
Example Trust sits in the lowest third of scored trusts on the SMI indicator, and its whole 95% rank range lies inside that third, so the position holds beyond month-to-month noise. The picture is split. Maternal outcomes are among the strongest in England, with severe postpartum haemorrhage at 2.1% against a typical 3.2%. Neonatal outcomes are in the bottom tenth. Among the smallest trusts by birth volume, the headline sits mid-group.
These figures are provisional and may be revised.
Sources: SMI indicator and sub-themes, August 2026; 95% rank range from six months of scores; birth-volume peer group. Chart: Example Trust against the typical trust on four outcome measures. Severe haemorrhage 2.1% against 3.2%; third or fourth degree tears 2.5% against 3.0%; Apgar below 7 at five minutes 2.4% against 1.5%; babies readmitted within 30 days 8.5% against 5.6%.
What is improving, and what is not?
Since February the SMI indicator has improved, almost all of it from neonatal outcomes. Babies readmitted within 30 days fell from 10.8% to 8.5%, and preterm birth fell from 7.6% to 5.6%. Over the full 12 months, no score shows a statistically significant trend, so this is not yet a sustained improvement. Readmissions remain well above the typical 5.6%, and Apgar scores below 7 at five minutes stand at 2.4% against 1.5%.
Readmissions are a rolling three-month figure, April to June 2026, so they describe a cohort of babies across those three months.
Sources: Score change, February to August 2026; 12-month trend test; neonatal measures, provisional. Chart: February to August 2026. Babies readmitted within 30 days fell from 10.8% to 8.5%; preterm birth fell from 7.6% to 5.6%; Apgar below 7 at five minutes rose from 2.2% to 2.4%.
Where should we look first?
Start with babies readmitted within 30 days. It is the only scored measure with a confirmed review trigger, and it has been signalling for five months. Look at it alongside Apgar scores below 7 at five minutes: together they pull neonatal outcomes down further than anything else. Caesarean, induction and vaginal birth after caesarean rates all sit within the range most trusts sit in.
A review trigger is a prompt for a structured look. Whether anything is wrong is for the clinicians to judge.
Sources: Review triggers and neonatal drivers, August 2026; variation measures, 12 months to August 2026. Chart: babies readmitted within 30 days, monthly, September 2025 to August 2026, between 6.0% and 10.8% and above the typical trust’s 5.6% throughout.
Is this a real problem, or noise?
The overall position is real: the 95% rank range sits entirely in the lowest third across six months of scores. Measure by measure, the picture is calmer. On statistical process control charts, 18 measures show only common-cause variation and none shows a concerning special cause. One shows a statistically real improvement: women smoke-free at 36 weeks. The readmissions trigger comes from a second test that looks for a sustained shift, so the two views should be read together.
Neither test says why a measure moved. That is for the clinical team to judge.
Sources: Rank confidence, six months to August 2026; SPC board view; review triggers. Chart: SMI indicator and neonatal outcomes score, monthly, September 2025 to August 2026, both below the national centre since November 2025, with neonatal outcomes lowest in January 2026.
Could we show a regulator, or a family, how we know?
Yes. Every SMI figure here comes from the national Maternity Services Data Set, with the period it describes, and the rating comes from CQC. Example Trust’s CQC maternity rating is Requires improvement, from an inspection more than three years ago. Across England, CQC ratings and the SMI indicator are only weakly related, because they measure different things. I can draft this month’s board paragraph for the Director of Midwifery to review.
Sources: Maternity Services Data Set; CQC maternity ratings; CQC and SMI correlation across 105 scored trusts.
Same figures, every level
We read one national dataset every month: more than 100 measures on one published method. Trusts, ICBs, regions and national teams see the same figures, so the conversation moves from whose numbers are right to what to do about them. The figures on this page use data to August 2026 (provisional), and the index updates every month.
“Do you know where your service sits on each measure, and why?”
Assurance you can evidence, month by month
The cost of maternity harm at the average trust is about £19.5m a year, counted from 2025/26 incidents. Strasys calculation from NHS Resolution figures.
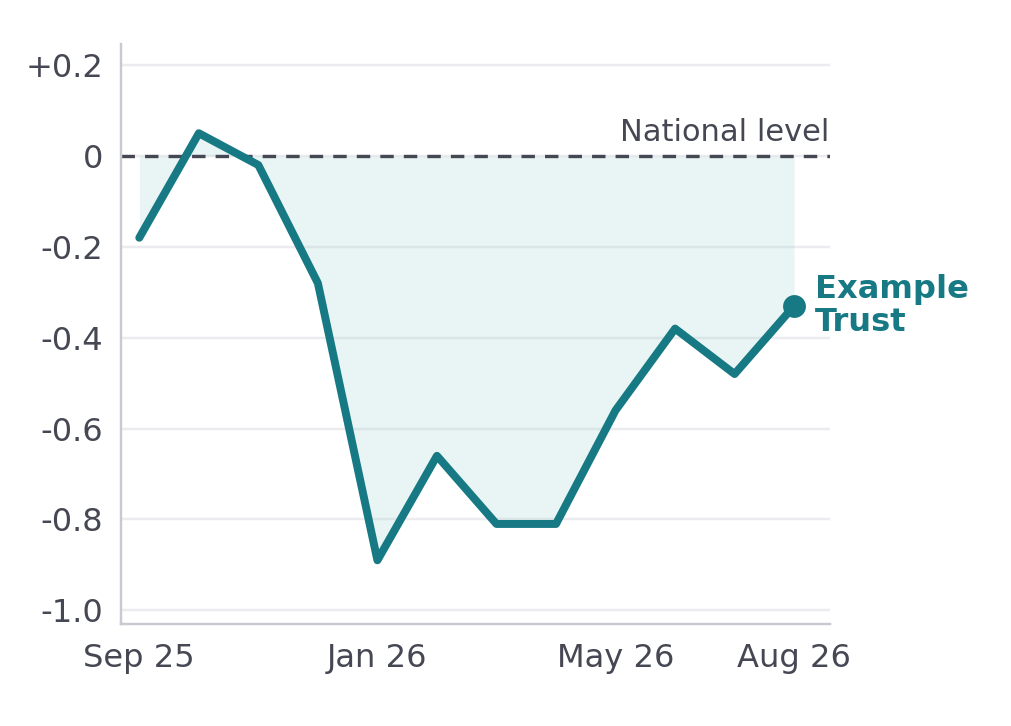
Example Trust’s SMI indicator over the 12 months to August 2026 (provisional). Mia explains what moved it, measure by measure.
“Do you know how the trusts you commission compare, and why?”
Commission for safer care, with the evidence to hand
Your trusts see the same figures you do. The method is published, and an independent clinical panel guides how it develops.
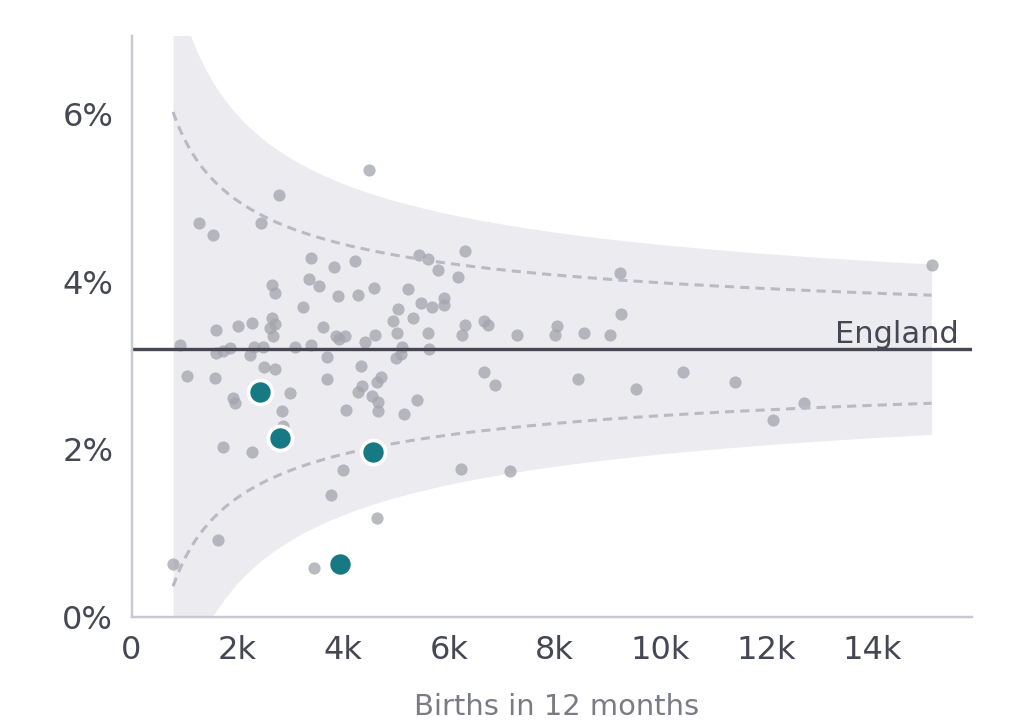
Severe bleeding after birth (1,500ml or more), 12 months to August 2026. Each dot is a trust, placed by its number of births. Teal marks one ICB’s four trusts; the shaded funnel is the range expected for a trust of that size.
“Do you know which of your trusts are drifting, and why?”
Send support where it is needed
For a region of 17 trusts, a 1% fall in harm would be worth about £3.3m a year. Strasys calculation from NHS Resolution figures, with an illustrative region size.
Mia traces what carried one trust from near the bottom of the index to the top in a single year while it served one of the most deprived populations in England.
“What if every body that oversees maternity worked from the same figures?”
Ask once, use everywhere
Baroness Amos’s national investigation called for a unified national dataset to monitor trends and performance.
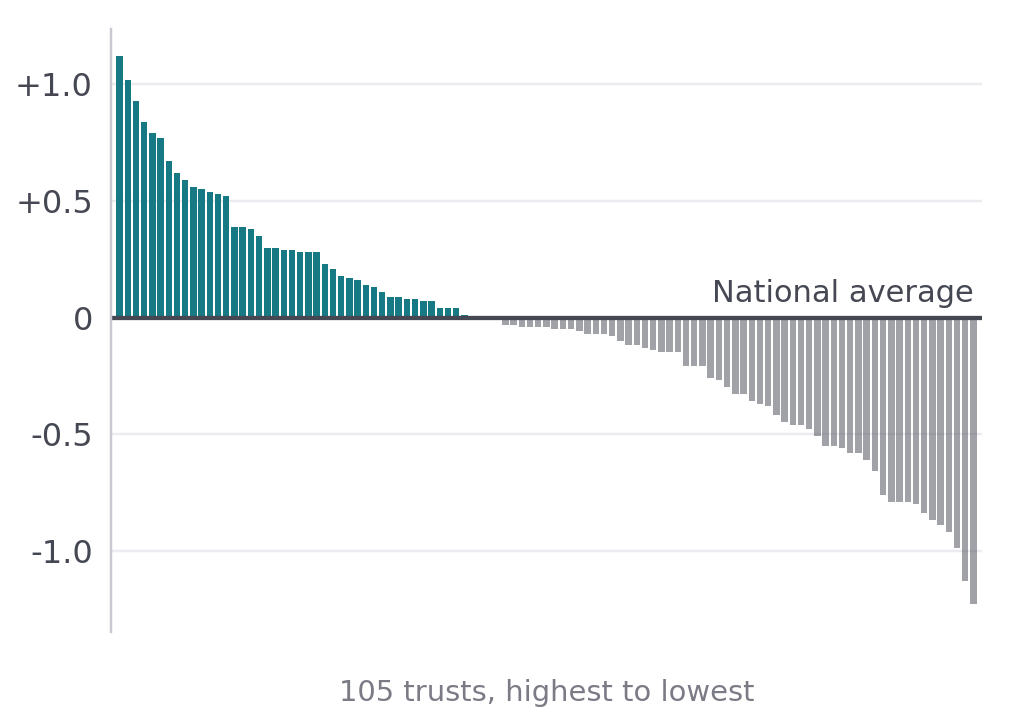
Each bar is one trust’s SMI indicator for August 2026 (provisional), highest to lowest. The line at 0 is the national average, and teal bars sit above it.
It tells your board which signals are real
Each month the index runs two statistical tests on every measure. Process control charts separate real change from month-to-month noise, and review triggers flag a sustained shift against the trust’s own baseline. Mia then suggests actions, each linked to the measures it is about, and flags any issue that keeps recurring as persistent. Suggested actions and persistent issues are visible only to your own organisation.
A review trigger starts a structured look, and your clinicians judge what it means.
Would your board have known?
One maternity service kept its Good rating while it fell from among the best performers in England to among the lowest in eleven months. Across England, inspection and current data often give two different verdicts. Each line below is one trust, running from its CQC maternity rating to its SMI position. If the two agreed, the lines would run flat.
How often a CQC maternity rating and the SMI rank a pair of trusts the same way round, across 117 trusts in May 2026. A coin toss would give 50%.
When the typical maternity rating in England was given. Some ratings still standing date from 2020.
Trusts rated Inadequate for maternity in March 2026 that sat in the bottom third of the country on that month's data.
Inspection sees what a monthly extract cannot, such as whether a midwife feels able to raise a concern at three in the morning. A rating is still a picture of one day, and services move on. Between inspections, what tells your board that its service is safe this month?
Across the middle 90% of trusts, major haemorrhage after birth ranges from 1.5% to 4.4% of births, and a low Apgar score at five minutes from 0.7% to 2.7% of term babies. Deprivation, maternal age, obesity and smoking together explain about 7% of the difference in bleeding. Some of the rest reflects how units measure blood loss, and most of it is how services work, which means it can be changed.
12-month trust rates, August 2025 to July 2026. Original Strasys analysis of the Maternity Services Data Set.
Baroness Amos's national maternity and neonatal investigation reported on 30 June 2026. It found that standards of care vary between trusts, and called for national standards and a unified national dataset to monitor trends and performance. The National Maternity and Neonatal Taskforce, chaired by the Health Secretary, is turning its recommendations into one national action plan.
Donna Ockenden's review of maternity care in Nottingham, drawing on around 2,500 families, reported on 24 June 2026. It found that leaders knew of problems from at least 2010 and did not act on them. Could your board see that pattern in its own data?
See the blind spots inspection cannot reach
The trust's Good rating came from an inspection three years earlier. Its slide showed in the months in between, which is where Mia looks. Real national data, with the trust anonymised.
The missing middle
Every trust submits its maternity data each month to the national Maternity Services Data Set. MOSS, NHS England's Maternity Outcomes Signal System, raises a signal when serious outcomes rise above a unit's usual rate. The national investigation found it cannot work as well as intended without good-quality data. Between the two sits the month-by-month picture of how care is changing, and most boards still assemble it by hand.
In a national HQIP survey in 2022, 71% of respondents reported difficulty accessing local data from national datasets. The SMI provides that middle layer for every trust, alongside MOSS and your perinatal quality surveillance report. A gap in the data is flagged and can never lift a score.
Guided by independent clinical leaders
Our independent clinical advisory panel guides how the index develops.

Nafiza Anwar MBE
Director and co-founder, Association of South Asian Midwives
Expert Reference Group member, National Maternity and Neonatal Taskforce. Doctoral researcher.

Benash Nazmeen MBE
Assistant Professor in Midwifery, University of Bradford
Co-founder, Association of South Asian Midwives. Co-chair, Racial Injustice in UK Maternity Services (Birthrights). MBRRACE-UK panel member.

Emma Rajakrishnen
Maternity quality improvement expert
Former ICB Head of Quality. Member of the Ockenden Review team. Founder of the Elythia Project.
The most expensive way to run a safety system
England pays heavily for maternity harm after it has happened and ringfences very little to help services prevent it. See how maternity services in England are organised and funded.
The cost of maternity harm from incidents in 2025/26, 48% of the NHS total of £4.8bn.
About 80p of future harm liability is added for every £1 England spends running maternity services.
£2.3bn cost of harm against about £3bn spend: 77p in 2025/26, 83p in 2024/25. NHS Resolution; NHS England Board paper, March 2023.
The cost of maternity harm at your scale
How many births does your unit have each year?
The cost of maternity harm a unit of this size carries each year.
What it pays each year in CNST maternity contributions, which cover only about half of that cost.
The Strasys Maternity Index costs a small fraction of a single maternity claim, and that is before counting the management, reporting and assurance time it gives back to your teams.
Which of your measures is moving this month?
Book a board sessionEngland averages per birth, so a unit's own figures will differ with its case mix and claims history. Cost of harm: £2.3bn from 2025/26 incidents; CNST maternity contributions: £1.19bn in 2025/26 (NHS Resolution annual report and accounts 2025/26 and finance data by trust). Births: 565,944 in the 12 months to July 2026 (MSDS). Strasys calculation.
Could your board answer these every month?
Seven questions from our briefing, From data to trajectory. Answer each one for your own board.
0 of 7 answered. Questions from From data to trajectory, Strasys, 2026.
FAQ
How can NHS trusts improve maternity services?
Trusts improve maternity care when boards review outcomes monthly against similar trusts, act where variation is widest and check whether each action moved the measure. Strasys Maternity Index analysis of 118 English trusts finds severe haemorrhage varies 2.9-fold across the middle 90%, and case-mix explains only about 7% of it.
Much of the method needs no product: read data as a trend over time, use statistical process control charts in place of red-amber-green ratings, track a monthly recommendation score from women, and break every key measure down by ethnicity and deprivation. The SMI does this for every trust, every month.
How should an NHS board monitor maternity safety?
Boards should see the same monthly picture as their regulators: where the service stands against trusts of a similar size, which measures are improving or worsening, whether the data is complete, and whether past actions moved the measures they targeted. The SMI provides this from the national Maternity Services Data Set for all 118 maternity trusts in England, with no new data collection.
How do you benchmark maternity safety across NHS trusts?
We read the national Maternity Services Data Set for every NHS trust in England that provides maternity care, every month, and compare each trust with the national picture and with trusts of a similar size. Thirteen outcome and care measures are scored into one SMI indicator, every rank carries a 95% range so that small differences are not over-read, and more than 100 measures in all are shown for context. No patient-level data is needed from trusts.
How does the SMI work alongside MOSS?
MOSS, NHS England's Maternity Outcomes Signal System, raises a signal when rates of serious outcomes such as stillbirth and neonatal death rise. The SMI reads more than 100 routine measures each month and shows how care is changing across outcomes, care processes and data quality. A board can use a MOSS signal as a trigger and the SMI to understand what sits behind it.
How does the SMI keep comparisons fair to every trust?
Each trust is compared with trusts of a similar size, and every rank carries a 95% range, so a board can tell a real difference from noise. Thirteen measures are scored, across neonatal outcomes, maternal outcomes and care delivery. Caesarean, induction and instrumental birth rates are not scored. They are shown against the range most trusts sit in, for clinicians to interpret. A gap in a trust’s data can never lift its score: a figure above the national centre fades back to it, and one below is carried forward for up to a year. A trust is not scored when the SMI receives too little usable data for part of the index, and that says nothing about the quality of its care. In August 2026, 105 of 118 trusts were scored. National scores use public data only, so a subscription never changes a trust’s score.
What is Mia, and is it clinically safe?
Mia, the Maternity Intelligence Agent, is the first live part of SIA, the Strasys Intelligence Agent. You ask questions in plain English and Mia answers from your trust's data, benchmarked nationally, with every figure traced to its source. Mia says when evidence is too thin to call. It does not make clinical decisions or trigger clinical actions. Those stay with the clinicians and board accountable for care.
Is the SMI aligned to Ockenden, CNST and CQC requirements?
Yes. The measures map to the Immediate and Essential Actions from the Ockenden review of maternity services at Shrewsbury and Telford (2022), the CNST maternity incentive scheme safety actions and CQC Well-Led. CQC maternity ratings and Maternity Survey results sit beside each trust's scores, so a board can explain its position as it appears in national data.
How is the Strasys Maternity Index built?
The Strasys Maternity Index (SMI) reads published national maternity data, principally the Maternity Services Data Set, for every NHS trust in England that provides maternity care, and recalculates each trust's position every month. Thirteen outcome and care measures are scored and combined into one SMI indicator, weighted 40% to neonatal outcomes, 30% to maternal outcomes and 30% to care delivery. Many measures use rolling periods so that a single month cannot swing them, and every trust's rank carries a 95% range. The remaining measures are shown for context and variation without being scored. No patient-level data is needed from trusts.
What are the limits of the index?
The SMI is comparative: it shows where a trust sits against other trusts in England, which is a different thing from an absolute standard of safe care. It relies on published national data, which describes months already past (publication runs about 50 days behind month end) and depends on what each trust submits. It shows patterns and direction of travel, and explaining why a pattern exists needs local investigation and clinical review. Its job is to support clinical judgement, local intelligence and regulatory assessment.
What is SIA, the Strasys Intelligence Agent?
SIA is the AI agent that runs across the Strasys Decision Intelligence platform, answering questions in plain English from the data each product holds. Mia, inside the Strasys Maternity Index, is its first live capability. SIA for workforce, clinical productivity, governance, value and service review is coming soon.
How can the SMI help a board prepare for the national maternity action plan?
The national action plan will follow Baroness Amos's investigation, which called for national standards and a unified national dataset to monitor trends and performance. The SMI already gives every trust, ICB and region the same monthly view from national maternity data, so a board can show where its service stands and which way it is moving before the plan sets new expectations.
Why do CQC ratings and the SMI often disagree?
They measure different things at different times. A CQC rating records an inspection on a particular day, and many ratings still standing date from 2024 or earlier, while the SMI reads routine outcome and care measures every month. Across 117 trusts in May 2026, a CQC maternity rating and the SMI ranked a pair of trusts the same way round 52% of the time, close to a coin toss. Inspection sees things data cannot, such as culture, so a board needs both.
What data does the SMI use, and how is it governed?
The SMI uses published, aggregate national data: the Maternity Services Data Set, which is published with counts rounded to the nearest five, alongside CQC ratings and survey results. It needs no patient-level data from trusts, and national scores use public data only. Any local data a trust chooses to add stays in a store only that trust can see. How we govern AI and data.
How does the SMI differ from existing maternity dashboards?
Most maternity dashboards show one trust's own figures, built locally and read a month at a time. The SMI reads every trust in England on one published method, shows which way each measure is moving and whether a change is statistically real, flags weak or incomplete data, and lets a board ask Mia in plain English why a figure moved.
How is the SMI delivered?
As a subscription web application with a secure log-in and monthly data refreshes. There is nothing to install and no new data to collect. It can be set up for a single trust, a provider group, an ICB, a region or a national body.
Can the SMI use our own maternity data?
Yes. The SMI runs on national data today, and the same engine can take your anonymised local data, such as ATAIN reviews, perinatal event notifications, incidents, workforce and patient experience. Each source is mapped to the same themes and appears in Mia and the Board Pulse. It stays in a store that only your trust can see.
Your trust is already in the index.
We will take your board through its position in a confidential session and show you what Mia sees, with a board report for your trust.
Where a woman gives birth should not decide how safe she and her baby are.